Work

Systems we designed, built and still stand behind

Four engagements, written out properly: the problem that started them, the system that answered it, the architecture underneath, and what changed once it was running. Where a client is not already named publicly, they are not named here — and no outcome on this page is a number we made up.

01 · Analytics portal · A distribution and services business

Operations & sales analytics portal

Monthly reporting ran on a stack of spreadsheets that had to be rebuilt by hand. We replaced the whole run — ingestion, validation, warehouse, analytics, and the authenticated portal the team now reads all of it in.
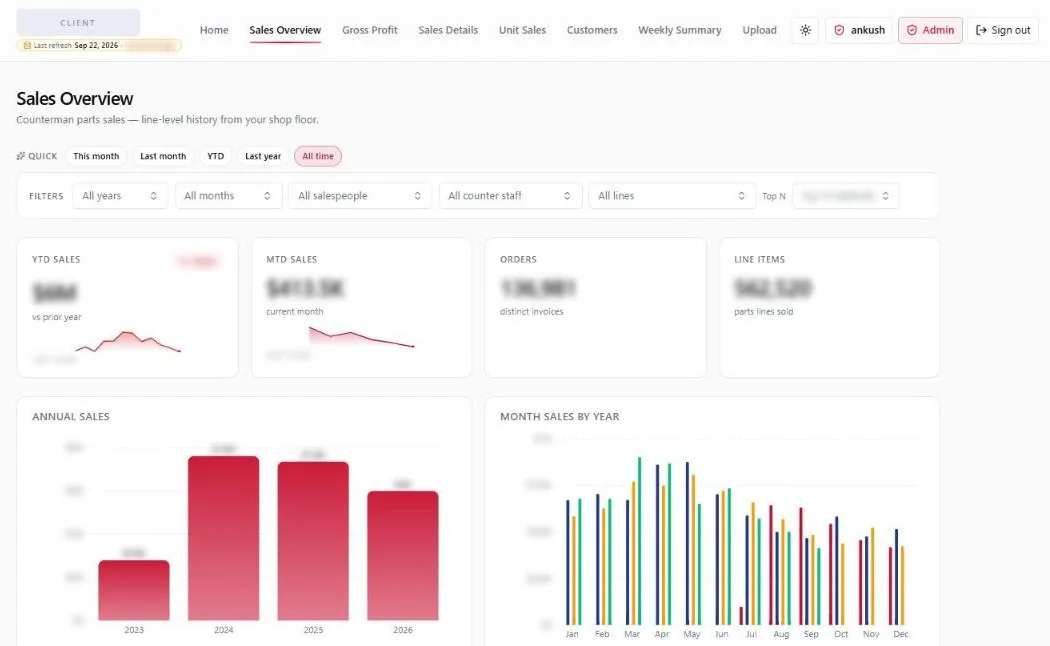
The live analytics portal from this engagement, anonymised: a sales overview with quick date filters, filters by salesperson, counter staff and product line, headline sales, orders and line-item cards, and annual and monthly sales charts. Client name, logo and all figures are blurred. Live client portal · name & figures blurred

The problem

Every month ran the same sequence: export from the operational systems, pull the sales sheets, reconcile against finance, rebuild the pivots, re-cut the customer summary, send it out. It took days, one person owned all of it, and it broke quietly whenever a source file changed shape.

The bigger problem was that the reporting was unverifiable. Two people could produce two different margin figures for the same month and neither could prove the other wrong, because the working lived in a spreadsheet nobody else had opened.

The system

One ingestion path that accepts the files the business already produces, checks them against agreed rules before anything commits, and loads them into a PostgreSQL warehouse — staged first, then modelled.

Above that, an authenticated portal: executive analytics, drill-through to customer and product level, and recurring reporting that goes out on a schedule rather than when somebody remembers.

Architecture

  1. SourcesERP, finance and operational exports
  2. IngestionUpload and scheduled load, validated first
  3. StoragePostgreSQL — staging, then a modelled layer
  4. Business logicOne written definition per metric
  5. ExperienceAuthenticated portal with drill-through
  6. AutomationRecurring executive reporting

What we built

  • Multi-file ingestion for the Excel and CSV sources already in use
  • Validation on every load — required columns, types, date ranges, totals that have to reconcile
  • Rejection with a readable reason, so a bad file never half-loads
  • PostgreSQL schema: staging, a dimensional model, and the marts the portal reads
  • Sales, margin and profitability analysis with customer and product drill-through
  • Authenticated portal with role-based access to pages and to rows
  • Recurring executive reporting, generated and delivered on a schedule
Outcome

OutcomeThe monthly rebuild is gone. Sales, margin and customer performance are current and in one place, the definitions are written down rather than embodied in one person’s spreadsheet, and a file that arrives wrong is rejected with a reason instead of quietly changing a number.

Stack

Next.jsTypeScriptPostgreSQLPythonSQLETLAuthenticationRole-based access
02 · AI platform · Built for CAARMO

AI diagnostic & reporting platform

A coaching business was hand-writing a diagnostic report for every new client. Now the assessment scores itself, the analysis is generated from those scores, and a branded PDF arrives without anyone touching it.

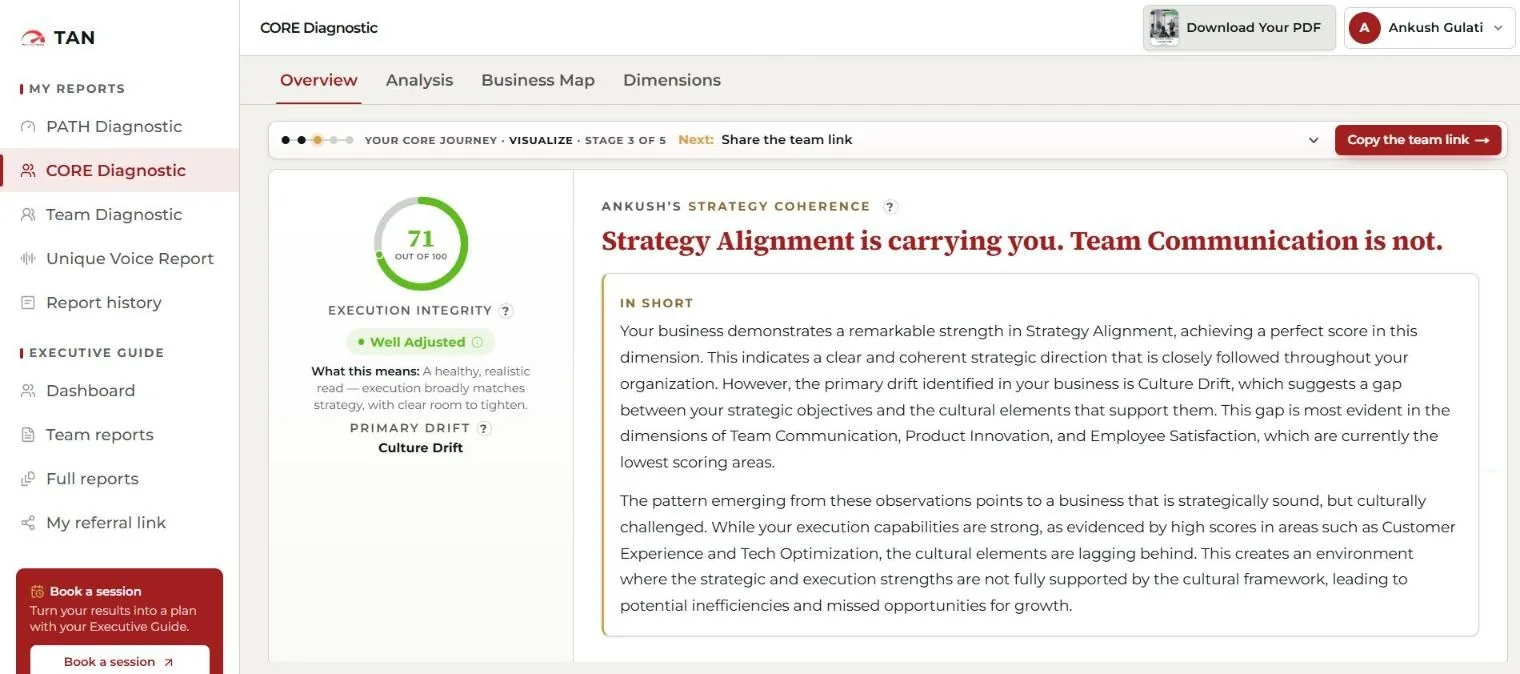
The live CAARMO diagnostic, running under a partner brand: an execution-integrity score out of 100, the primary drift named, and a written analysis generated from the scores, with a one-click PDF download. Live product · caarmo.cloud

The problem

Every new client started with a diagnostic: a conversation, a set of judgements, and a written report that took most of a working day to produce.

It did not scale, and more awkwardly it was not consistent — two people working from the same answers did not necessarily write the same report, which makes the output hard to compare and hard to trust.

The system

An intake that feeds a Python scoring engine, a generation step that writes the analysis from the scores rather than from a blank page, and a delivery step that renders and emails a branded PDF.

Around it, a multi-tenant portal so each organisation sees only its own respondents, with admin workflows and team-level reporting on top.

Architecture

  1. IntakeAssessment answers, captured per tenant
  2. VerificationEmail verification and account provisioning
  3. ScoringPython scores each dimension
  4. GenerationThe analysis is written from the scores
  5. DeliveryBranded PDF rendered and emailed
  6. AdministrationMulti-tenant admin and team reporting

What we built

  • Diagnostic and assessment workflow, scored per dimension
  • User verification and authenticated accounts
  • AI-generated analysis constrained by the scores, so the output is a position rather than a guess
  • Personalised report generation and PDF rendering
  • Automated email delivery of the finished report
  • Multi-tenant portal with admin workflows and team reporting

Outcome

OutcomeA twelve-hour report cycle became minutes, the write-up stays consistent between respondents, and more than 120 coaches run on it today. Owned and published by CAARMO; designed, built and maintained by Datavoris.

Stack

Next.jsPythonOpenAIPDF generationEmail deliveryMulti-tenantAuthentication
03 · SaaS product · Built, owned and run by Datavoris

Revora — marketing attribution platform

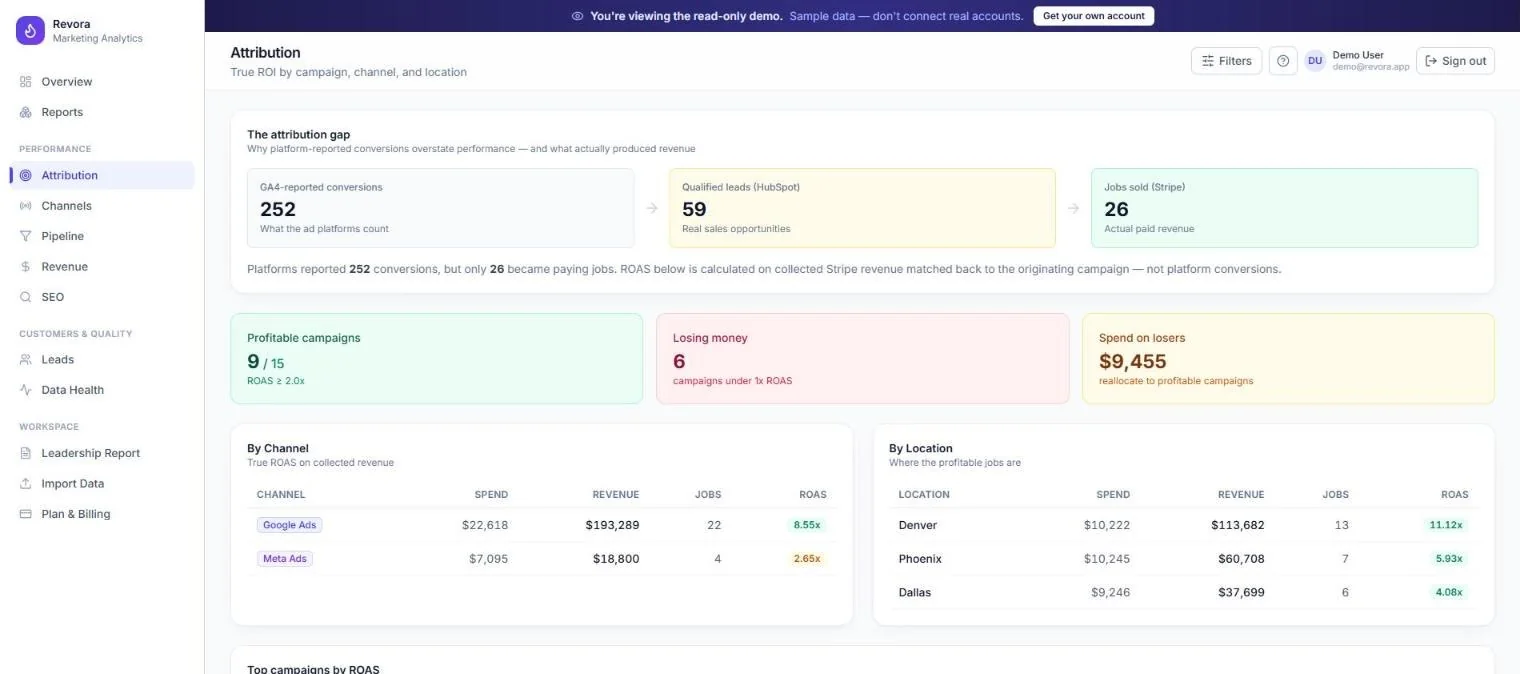
Ad platforms report the revenue they can see, and claim credit generously. Revora reports the revenue that actually landed, joined back to the spend that produced it.

Revora's attribution screen from the live demo: platform-reported conversions narrowed to qualified leads and paid jobs, profitable and loss-making campaigns, and true ROAS by channel and location. Live demo · revora.datavoris.com

The problem

For a lead-generation or home-services business a lead is not the finish line — a booked, paid job is. Generic marketing analytics stops at the lead.

That means budget decisions get made on a number that overstates what the spend actually produced, and the channel that looks best in the ad account is not always the one paying for itself.

The system

Spend pulled from the ad platforms, outcomes pulled from the CRM, and an attribution model that joins the two back together on a schedule.

On top of that: true ROAS, cost per acquisition and cost per booked job, split by campaign, channel and location — because a channel that works in one city and loses money in another looks merely average in aggregate.

Architecture

  1. SourcesAd platform APIs and the CRM
  2. IngestionScheduled sync, per tenant
  3. StorageModelled spend, lead and revenue tables
  4. Business logicSpend joined to booked, paid work
  5. ExperienceDashboards by campaign, channel and location
  6. OperationsHosted, monitored and run by us

What we built

  • Multi-tenant SaaS: database design, tenancy model and authentication
  • Ad platform and CRM integrations with scheduled synchronisation
  • Attribution logic joining spend to booked and paid outcomes
  • Campaign, channel and location reporting
  • Executive dashboards across the full front-to-back stack
  • Hosting, monitoring and the ongoing operation of a live product

Outcome

What it provesRevora is ours, which means we carry the consequences of every decision in it — including the wrong ones. Operating a product in production is a different discipline from handing one over, and it is the reason we will say yes to building software and not only reporting.

Stack

Next.jsTypeScriptNode.jsPostgreSQLREST APIsAuthenticationMulti-tenant
04 · Data platform · A multi-client reporting business

Multi-client data warehouse

Every new client meant standing up a data setup from scratch. One shared, partitioned warehouse replaced that — and new-client dashboards now go live in days rather than weeks.

A warehouse overview: table count, rows modelled, sources unified and refresh time, above a list of modelled tables showing their layer, row counts, refresh time and freshness status. Sample data · fictional company

The problem

Each new client arrived with their own sources, their own definitions and their own set of one-off pipelines.

Nothing was reusable, nothing was reviewable, and the setup cost was paid again in full every single time. The reporting was fine; the thing underneath it did not survive being repeated.

The system

One warehouse with per-client partitioning on a shared, versioned model. Client data stays isolated; the transformations stop being rewritten.

Onboarding a new client becomes configuration rather than construction, and an improvement to the model is an improvement for everyone on it rather than a change that has to be made six times.

Architecture

  1. SourcesPer-client systems, files and APIs
  2. IngestionShared ETL / ELT orchestration
  3. StorageOne warehouse, partitioned per client
  4. ModellingShared, versioned dimensional model
  5. AccessIsolation and access control per client
  6. DeliveryReporting layer reused across clients

What we built

  • Cloud warehouse on Microsoft Fabric and Snowflake
  • Dimensional modelling — star schemas, fact and dimension design
  • Schema design and ETL/ELT orchestration
  • Per-client partitioning with enforced data isolation
  • Versioned, reviewable transformations rather than ad-hoc scripts
  • A reusable reporting layer sitting on the shared model

Outcome

OutcomeNew-client dashboards go live in days rather than weeks, on one model that gets improved once instead of forked repeatedly — with each client’s data properly isolated from every other client’s.

Stack

Microsoft FabricSnowflakeSQLPythonDimensional modellingAccess control
About the screenshots

Real work, with the client taken out

Three of the four screens above are real: a live client portal with the company name, logo and every figure blurred, the live CAARMO diagnostic, and Revora’s public demo. The fourth runs on fictional sample data, and says so. Client data is not ours to publish, so where a client is not named publicly, nothing that identifies them is shown. Where a client is happy to be named — CAARMO, for instance — we name them. Everything else is available as a reference on request.

Tell us what you’re trying to build

The current workflow, where the data lives, what is manual or broken, and what the finished system has to do. You will get a real reply from Ankush — how we would approach it, roughly what it takes, and whether it is worth doing at all.